Questrade is now offering stock, ETF, and options trading at $0 commission. Their FAQs cover everything except for “How are they able to do it??”
read
Ready to start investing in 2025? Questrade makes it easier — and cheaper — than ever. Questrade offers zero trading fees on many accounts, along
read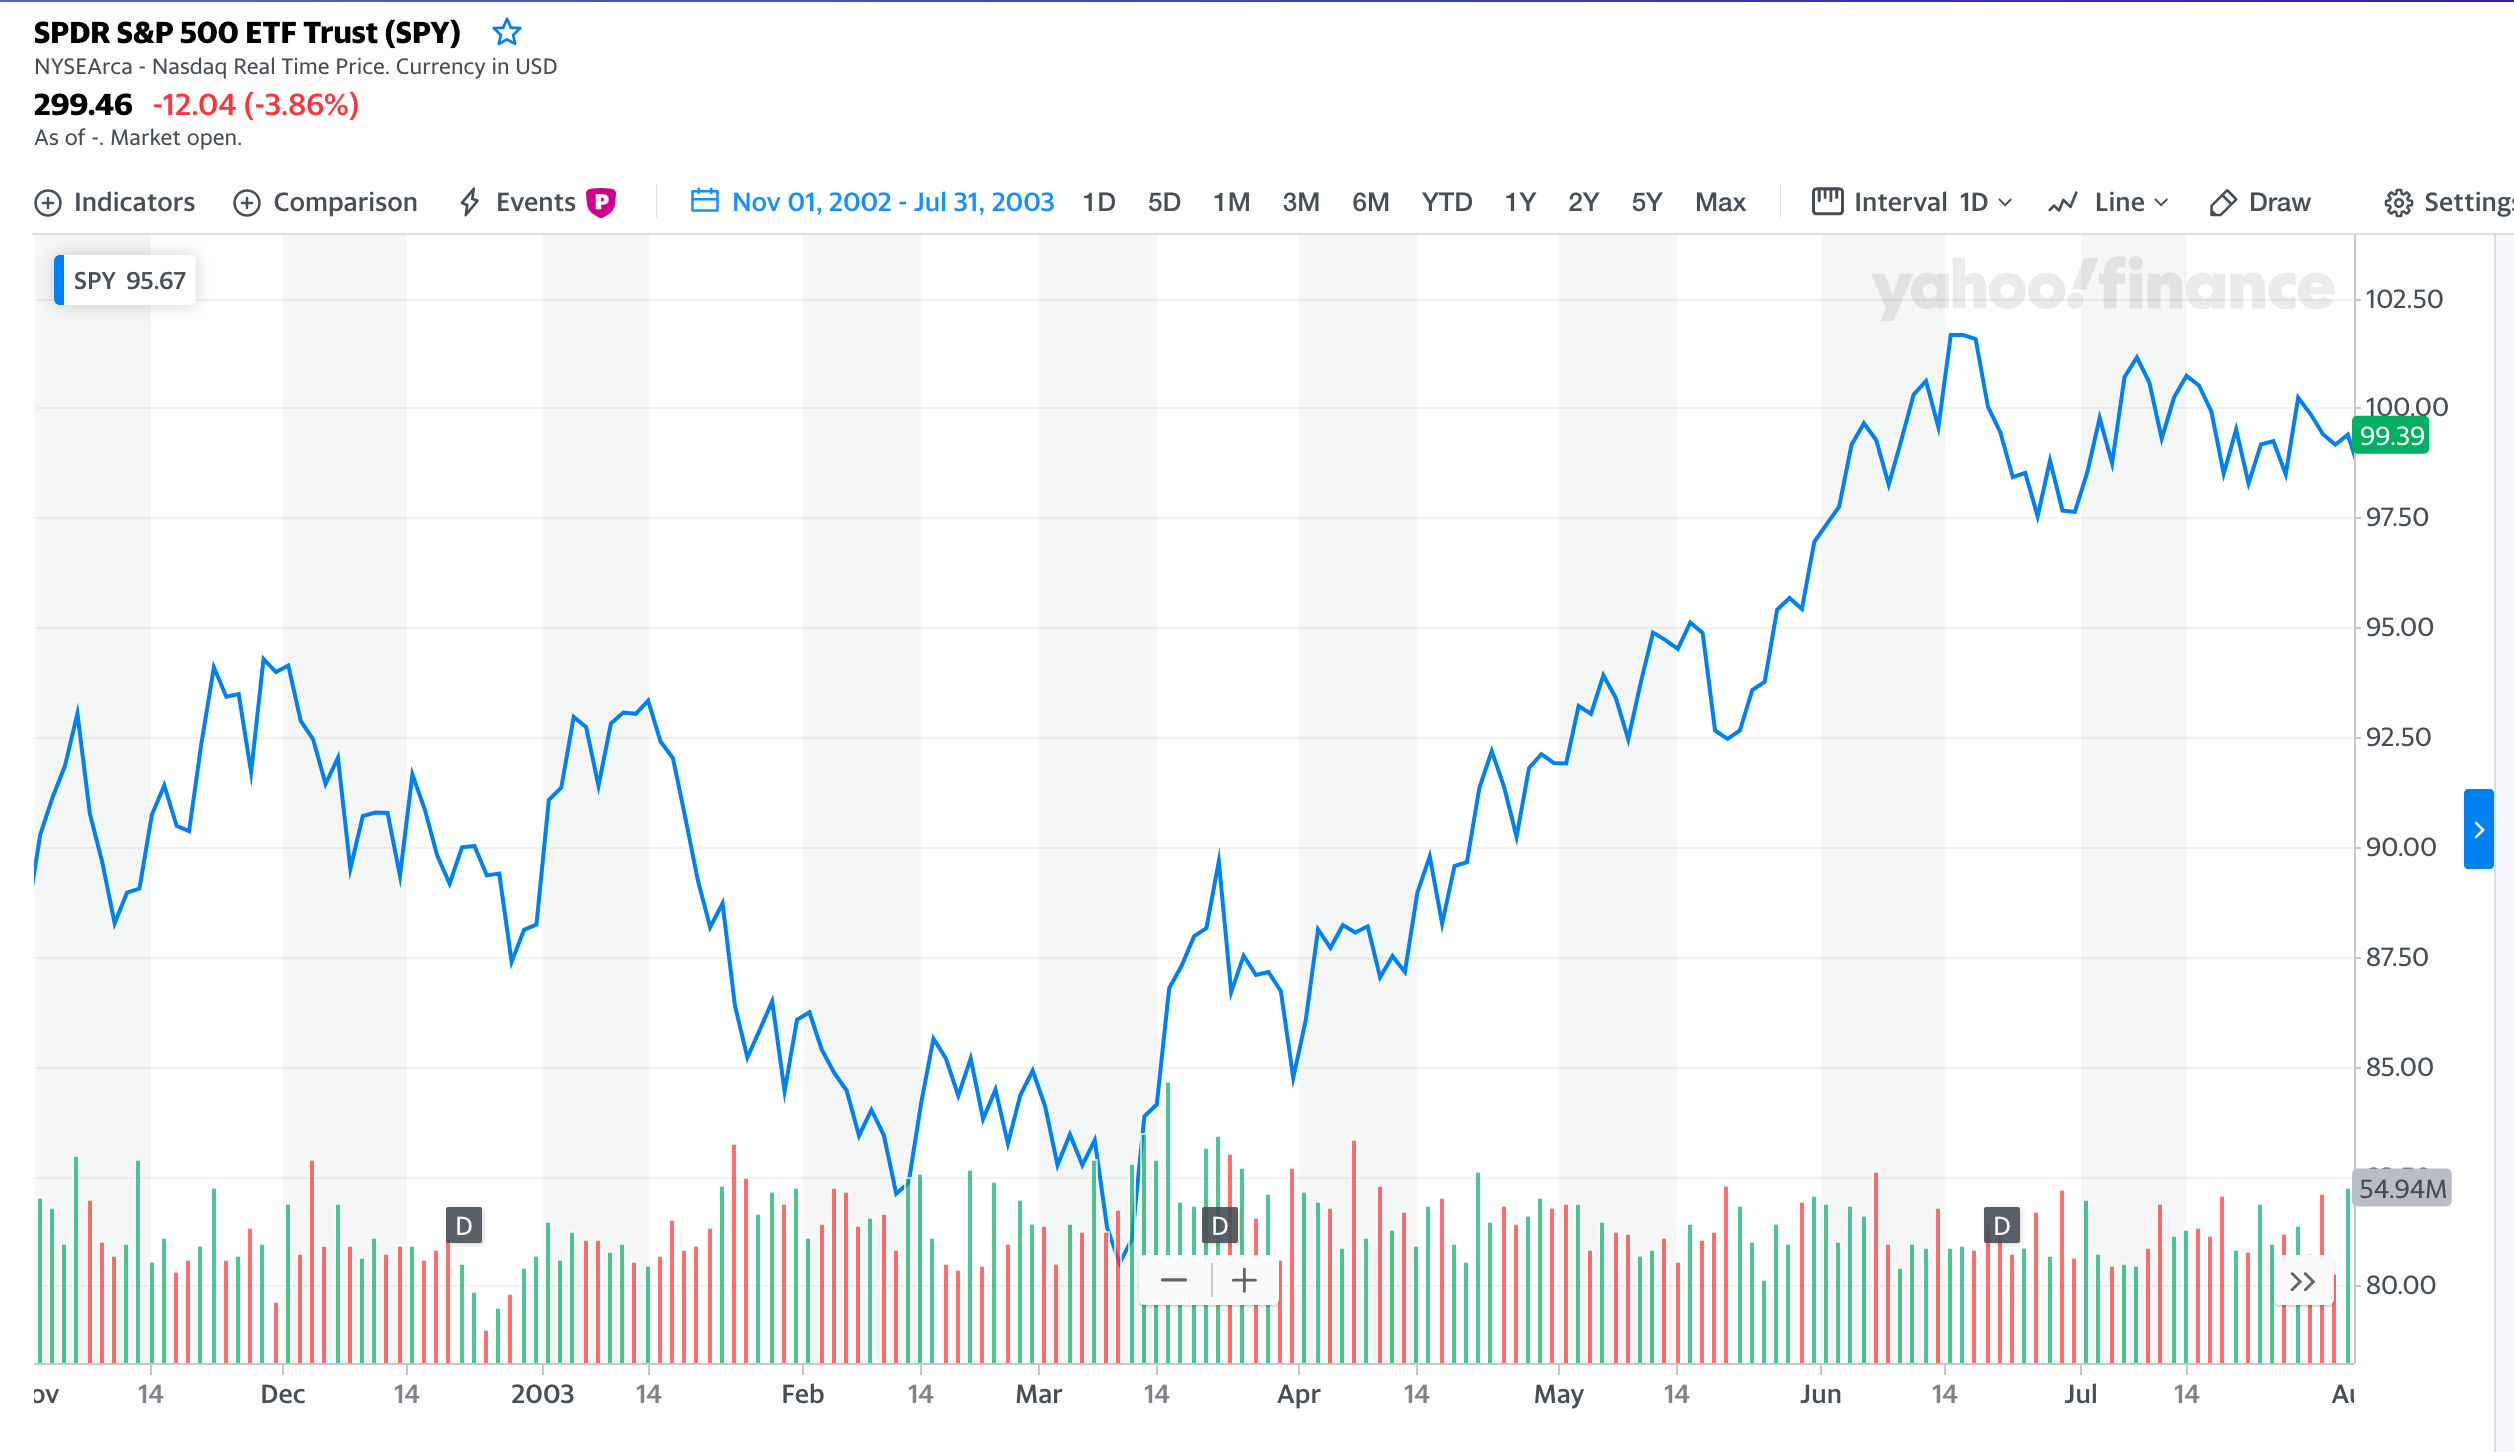
SARS was a “thing” from November 2002 to July 2003. The drop was from 94.28 to 80.52 (14.5%). All-time high was $339.08 and if we
readUnless we’re in for a surprise crash, a bounce of some sort is imminent. The weekly. A head & shoulders may be in the works.
readA.: No, you cannot. When shorting, your potential losses are unlimited, and your TFSA account IS limited. The only two ways to short stocks in
readThis chart is from a week ago. 10-year returns still aren’t impressing me at all. This is why it’s important to time the market. The
readCan someone please enlighten me as to what happened 2 weeks ago that made insiders go on such a wild shopping spree?
readFrankfurt returns are on par with the S&P 500, except for the 10-year return which is much better. Guess the German market didn’t drop as
readLooking at the runaway action on [[SPY]] and the abysmal performance of [[SLW]], I just have to laugh at myself. I mean it takes a
readLong shadows on the candles. MA’s converging. Low volume. This is what indecision looks like. Dog days of summer are upon us. Latest quote: [[SPY]]]
readWhy did they choose BRIC as the acronym for Brazil, China, India and Russia? Why not CRIB? Makes way more sense as these are emerging
readView More